Stockpixie

Making Markets Make Sense

Market Overview

Market Overview

Explore the stock universe by sector and compare company characteristics and model estimates in one interactive view.

Company Profile

Company Profile

Understand a company's factor profile, underlying fundamentals, and forward-looking model estimates in one view.

Analyst Recommendations

Analyst Recommendations

Track and visualize professional analyst recommendations over time for sentiment and signal insights.

Market Regime & Factors

Market Regime & Factors

Identify the market regime, follow style-factor rotation, and investigate the sectors driving risk and returns.

Technical Analysis

Technical Analysis

Study price and return history with configurable indicators for trend, momentum, volatility, and persistence.

Portfolio Manager

Portfolio Manager

Build transaction-aware portfolios, trace performance and risk, understand return drivers, and turn quantitative optimization into an actionable rebalancing plan.

Market Overview details

Market Overview

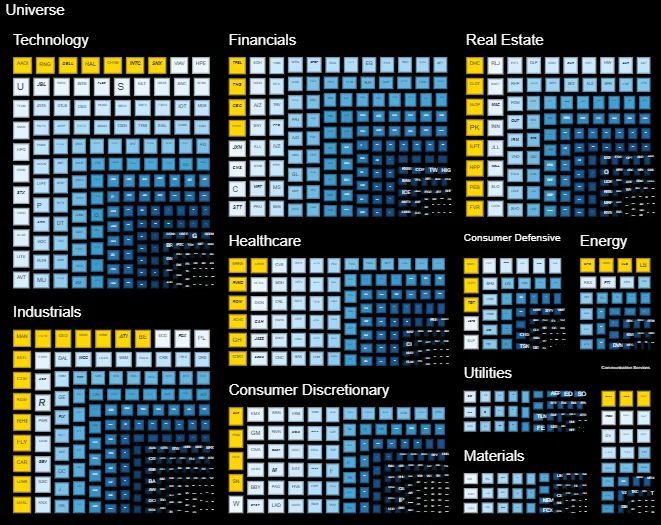
The Market Overview presents the Russell 1000 as an interactive treemap, turning a large stock universe into a compact view of sector structure and company-level positioning. Each tile represents a company, while the surrounding groups show where it sits within the broader market.

Reading the Market

Tile size and color can be configured independently using the available company measures. This makes it possible to compare different dimensions in the same view: one measure can determine tile area while another shows higher and lower values through color. The default setting uses Future MOM, the model’s six-month estimate of risk-adjusted outperformance versus the Russell 1000.

Tile area is driven by the selected size measure. Color is normalized across the displayed universe from dark to light, with the highest values highlighted in gold. The available measures include company and style characteristics such as value, quality, profitability, growth, momentum, financial strength, cash-flow quality, and risk, together with Future MOM and Future Risk.

From Market to Company

Hovering over a stock selects it across the connected dashboard, immediately updating the company profile and other security-level views. Clicking a tile locks that selection for closer investigation. Stocks held in the active portfolio are visually emphasized, with portfolio value, cost basis, profit or loss, and return available on hover.

Why It Matters

The treemap makes concentrations in the selected measure, sector patterns, and individual outliers easier to recognize than a conventional table. By allowing two measures to be viewed at once, Market Overview provides a practical starting point for finding companies whose current characteristics and forward-looking model estimates reinforce, or diverge from, one another.

Treemap of the Russell 1000 grouped by sector and colored by a selected company measure. Russell 1000 companies grouped by sector, with tile size and color controlled by independently selected measures.

Company Profile details

Company Profile

The Company Profile provides a compact view of how an individual stock is positioned across its most important financial and quantitative characteristics. Where the Market Overview supports top-down exploration, this view brings the analysis down to a single company and makes its strengths, weaknesses, and model outlook immediately visible.

Reading the Profile

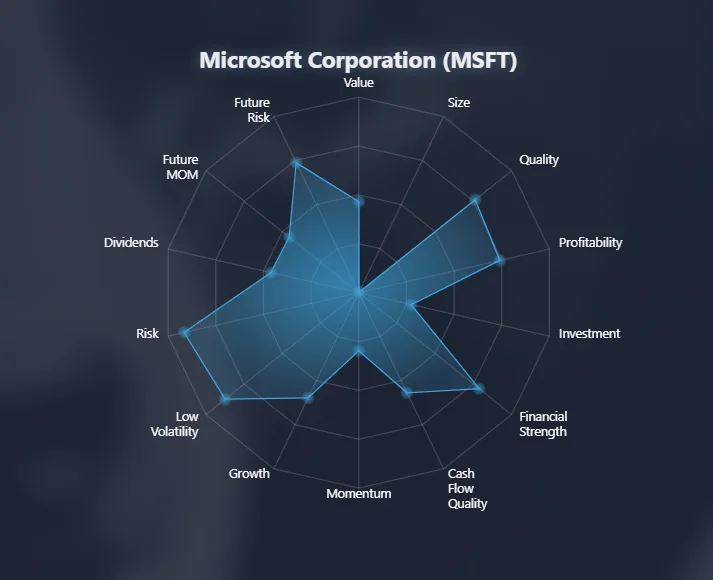
The radar chart combines normalized relative ranks across value, quality, profitability, investment, financial strength, cash-flow quality, growth, momentum, risk, low volatility, size, and dividends. Higher scores indicate a stronger tilt toward the named characteristic. The risk-related axes are oriented so that a higher score means lower historical or predicted risk.

The profile also includes Future MOM and Future Risk, the model’s estimates of risk-adjusted outperformance and volatility over the next six months. These forward-looking ranks sit alongside the company’s observed characteristics, making it easy to see whether the model outlook reinforces or contrasts with the current profile.

Hovering over an axis explains what it measures and, where available, shows supporting raw figures such as valuation multiples, margins, returns on capital, growth rates, leverage, cash-flow measures, and volatility. Clicking the company name opens its sector, industry, and business description.

Company Profile radar chart showing the relative characteristics of a selected stock. The Company Profile condenses a stock’s relative strengths, weaknesses, and model outlook into a single radar shape.

Why It Matters

By reducing a broad set of company data to one interpretable shape while keeping supporting figures available on hover, Company Profile supports both rapid comparison and deeper investigation. It offers a concise starting point for understanding what distinguishes a stock and where its principal opportunities or risks may lie.

Analyst Recommendations details

Analyst Recommendations

Sell-side analyst ratings condense fundamental views into structured buy, hold, or sell signals. These calls incorporate proprietary models, management commentary, and sector-level insights that are often unavailable in purely quantitative datasets. While individual forecasts may vary in quality, the collective behavior of analysts can reveal important sentiment trends.

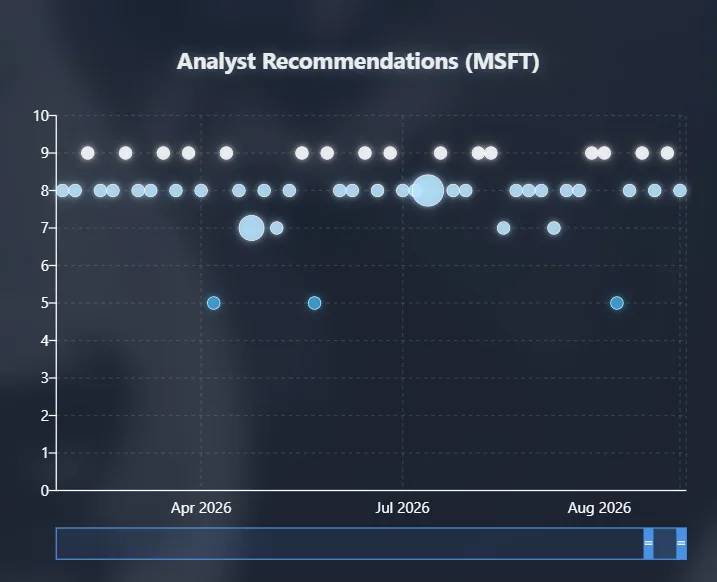
The Analyst Recommendations feature captures these dynamics over time, transforming ratings into a visual signal layer. Each analyst action is plotted along a timeline with:

  • Score on a normalized 0 to 10 scale, where 10 represents a strong buy and 0 a strong sell
  • Color intensity reflecting the conviction of the rating
  • Bubble size indicating the magnitude of change from the previous stance, highlighting upgrades and downgrades
  • Hover detail showing the analyst name, date, and rating transition

This format exposes inflection points in institutional perception and helps detect periods where market narrative diverges from fundamentals or price action.

Quantitative Use Cases

While often excluded from traditional quant models due to perceived bias or noise, analyst ratings have systematic properties that can be extracted when viewed collectively and contextually.

Key analytical patterns include:

  • Serial correlation: Large institutions frequently follow each other’s lead, creating momentum in recommendation flow
  • Event-driven clustering: Analyst updates often cluster around earnings releases, guidance revisions, or macro developments
  • Rating dispersion: Variability in ratings across firms can serve as a proxy for uncertainty or informational asymmetry
  • Velocity of change: The speed and frequency of revisions can indicate shifts in conviction or breaking developments

These patterns can enhance traditional factor models when used as a sentiment overlay, particularly for short-term signal alignment or risk flagging.

Visual Summary

The timeline enables rapid identification of:

  • Trends in consensus
  • Outlier opinions
  • Moments of coordinated action
  • Gaps between analyst sentiment and model outputs

Analyst recommendations timeline showing sentiment shifts. Bubble size reflects recommendation changes; color intensity indicates rating strength.

Timeline of analyst rating changes. Color and size encode recommendation strength and change magnitude.

Why It Matters

  • Sentiment Layering: Adds a behavioral dimension to fundamentally or technically derived signals
  • Narrative Detection: Helps identify turning points in institutional perception
  • Signal Confirmation: Validates or challenges model signals with expert-driven context

Analyst Recommendations offers a structured view into how the institutional lens shifts over time. While not predictive in isolation, these ratings provide valuable input when interpreted through the lens of timing, coordination, and rate of change.

Market Regime & Factors details

Market Regime & Factors

The Index Screener shifts the focus from individual companies to the forces shaping the broader equity market. It combines a market-regime model with systematic style-factor analysis, then connects those signals to the price and characteristic profile of the Russell 1000 or a selected sector.

Market Regime

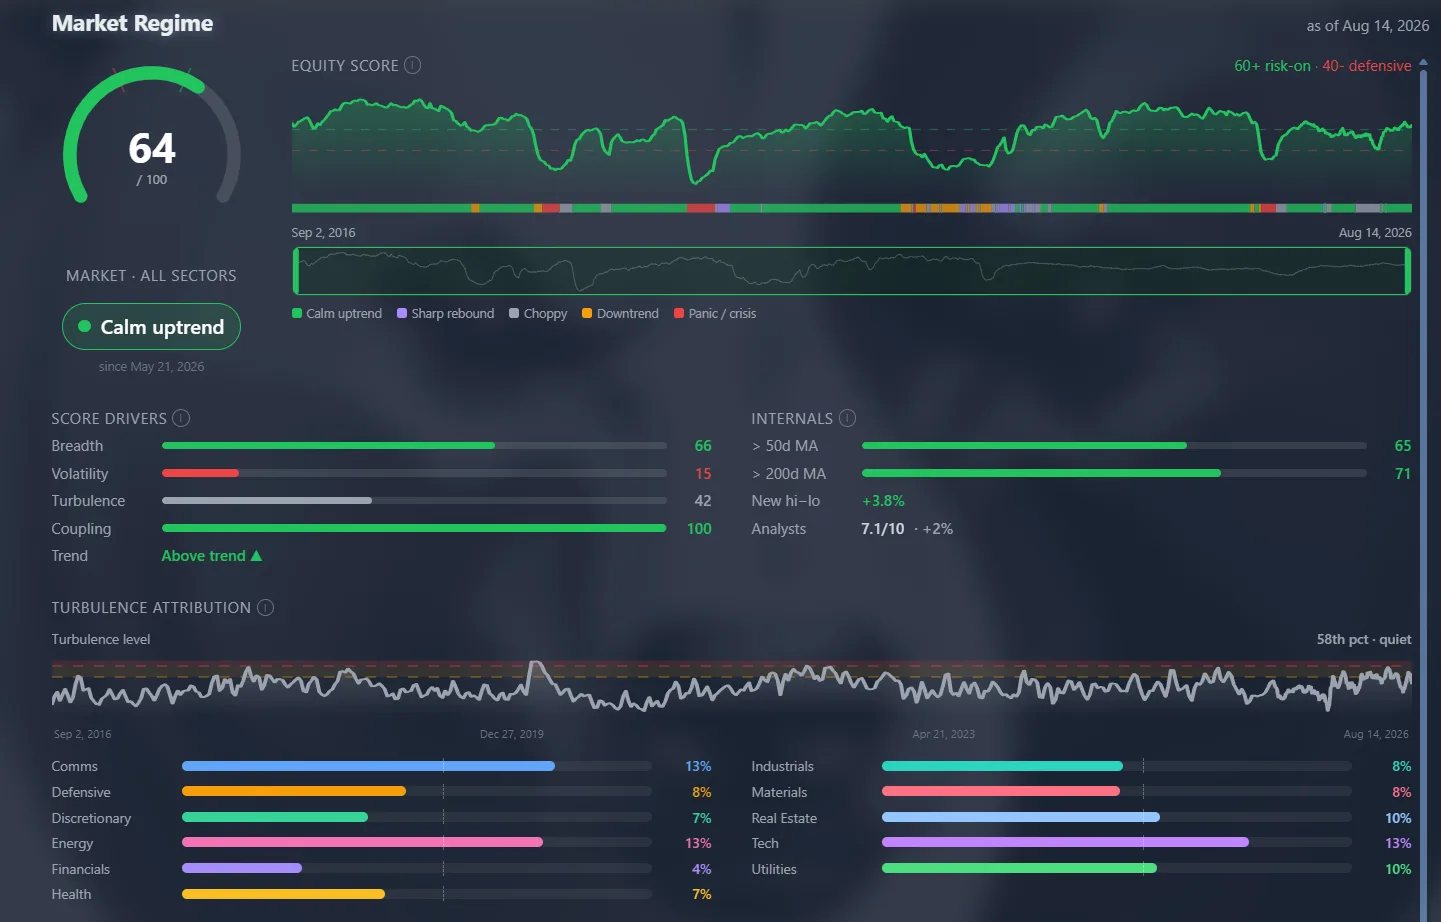
The Market Regime view classifies the current environment as a calm uptrend, sharp rebound, choppy sideways market, volatility-expanding downtrend, or panic and crisis state. A 0-to-100 equity score summarizes how favorable the backdrop is for a long-only investor using five equally weighted drivers: market breadth, realized volatility, financial turbulence, market coupling, and the long-term trend.

The score can be followed through history and inspected at any point on the timeline. Supporting market internals show participation above the 50- and 200-day moving averages, new highs versus new lows, and aggregate analyst sentiment. Turbulence attribution identifies which sectors are responsible for unusual cross-market behavior, while the comparison between the capitalization-weighted market and the equal-weighted universe reveals whether leadership is broad or concentrated. Sector scores and their recent changes provide a direct view of rotation beneath the headline index.

Market Regime dashboard showing the equity score, regime history, score drivers, market internals, and sector turbulence attribution. The regime dashboard connects the current market state with its historical path, underlying drivers, and the sectors contributing most to turbulence.

Market Style Factors

The Market Style Factors view shows which systematic investment characteristics are being rewarded or penalized. It follows Value, Quality, Profitability, Investment, Financial Strength, Cash Flow Quality, Momentum, Growth, Low Volatility, and Size, with the Russell 1000 return shown as market context.

A monthly rotation grid makes changes in factor leadership visible across 1-, 3-, 6-, and 12-month horizons. Selecting a factor opens its cumulative long-short return, volatility, Sharpe ratio, drawdown, and sector breadth, together with a sector-by-sector performance breakdown. Long and short basket diagnostics expose the valuation, profitability, growth, leverage, beta, market-cap, and turnover characteristics behind the return, helping distinguish a genuine style premium from a narrow sector effect.

Market Style Factors dashboard showing the style-rotation grid and cumulative long-short factor performance. The style-factor view shows how leadership rotates through time and whether a selected factor’s return is broad across sectors or concentrated in only a few.

Connected Market Context

Selecting a market or sector view keeps the rest of the Index Screener in sync. The linked chart provides price, return, and technical-indicator history, while the sector profile summarizes the selected group’s current characteristics. Together, these views move from a broad question, What kind of market are we in?, to the more specific questions of Which styles are working, how broadly are they working, and which sectors are driving the result?

Russell 1000 index price history with configurable technical-analysis overlays. The linked index chart places the broader market’s price and return history alongside the same configurable technical-analysis tools available elsewhere in Stockpixie.

Utilities sector profile radar showing its current relative characteristics. Utilities shown as an example of the sector-level profile, which condenses the selected group’s current characteristics into a comparable radar shape.

Why It Matters

Market direction alone does not explain whether a rally is healthy, which risks are building beneath the index, or what kind of companies investors currently favor. Market Regime & Factors brings those dimensions together, providing a historically grounded view of risk conditions, participation, sector leadership, and factor rotation before the analysis moves down to individual securities.

Technical Analysis details

Technical Analysis

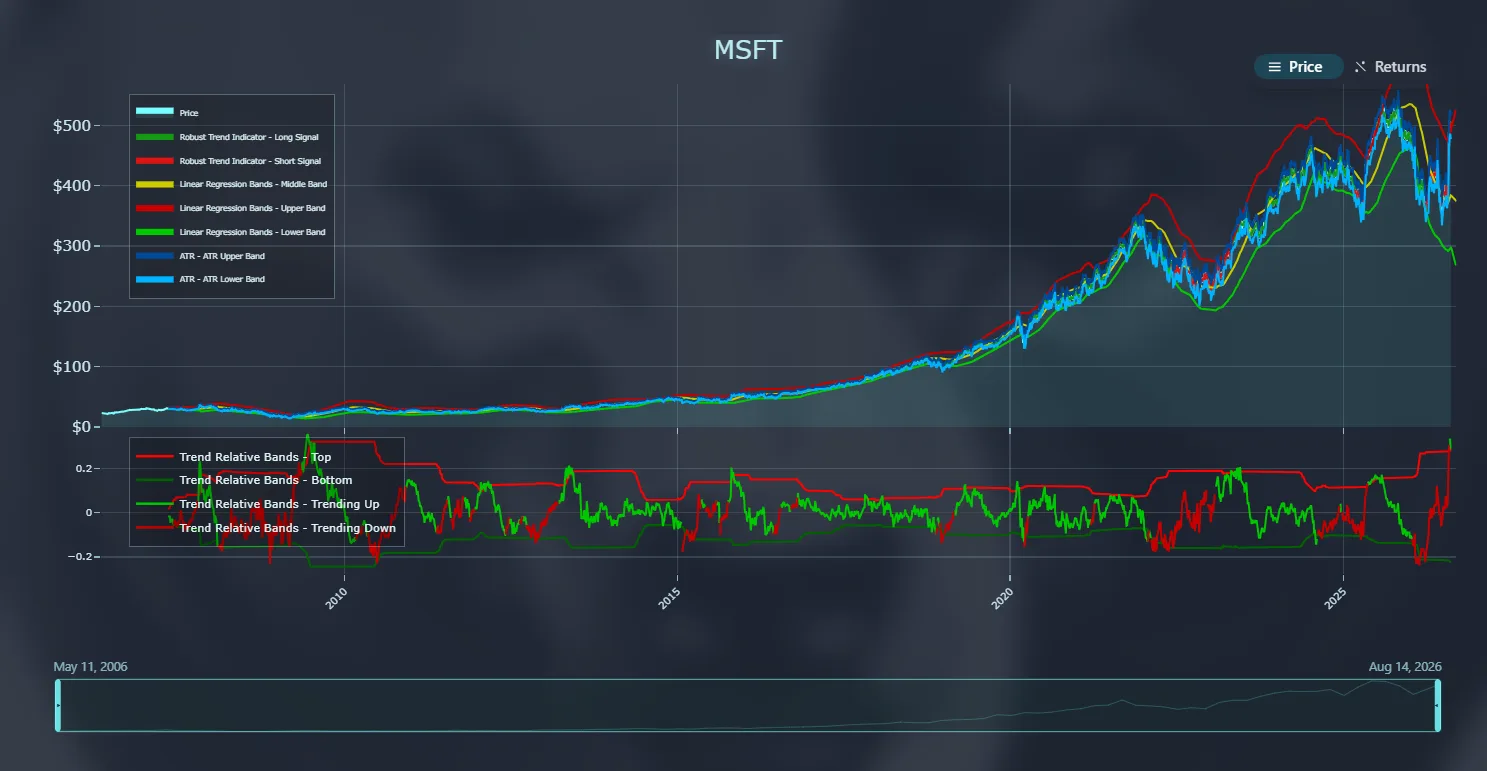
Technical Analysis provides a configurable charting workspace for examining how a stock’s price behavior has evolved over time. The same history can be viewed as a line or candlestick chart, while the Returns view plots close and adjusted-close percentage returns from the first date in the selected range.

Building the Chart

Indicators can be added individually, combined, and configured to suit the analysis. Price overlays include simple and exponential moving averages, Supertrend, SupertrendPro, the Mean Reversal Indicator, Bollinger Bands, Linear Regression Bands, ATR bands, and the Robust Trend Indicator. RSI, MACD, the Correlation Trend Indicator, SqueezePro, Trend Relative Bands, and Autocorrelation are displayed in aligned panels below the price chart.

Lookback periods, thresholds, multipliers, forecast horizons, and series colors can be adjusted where the indicator supports them. Saved configurations remain available as the selected ticker changes, allowing the same analytical setup to be applied consistently across companies.

Reading Price and Positioning

The time-range navigator focuses the chart on a chosen historical window without requiring the chart to be rebuilt. Hover details expose the value of each price or indicator series at a given date. When the selected ticker has recorded portfolio transactions, buy and sell markers can also be shown on the timeline, connecting price behavior with actual trading activity.

Microsoft price chart with Robust Trend Indicator, Linear Regression Bands, ATR bands, and Trend Relative Bands. MSFT price history with configurable overlays, a separate trend-relative panel, and an adjustable time-range navigator.

Why It Matters

No single indicator describes every market condition. By placing complementary measures of direction, momentum, volatility, and persistence in one synchronized view, Technical Analysis helps distinguish durable trends from temporary moves and provides clearer context for timing, risk management, and portfolio review.

Portfolio Manager details

Portfolio Manager

The Portfolio Manager is a transaction-aware workspace for building an equity portfolio, understanding what is driving it, and testing how its allocation could be improved. It brings portfolio administration, performance measurement, risk analysis, factor attribution, and optimization into one connected view.

Build and Maintain the Portfolio

Separate portfolios can be created, renamed, and selected from the same dashboard. Buy and sell transactions update the holdings automatically, while the portfolio header keeps total value and return in view and provides a breakdown of unrealized and realized profit and loss, net deposits, and cost basis. Transaction history and CSV import and export make it practical to maintain or move a portfolio without rebuilding it by hand.

The holdings table turns that history into a current position-level view. It includes price, market value, daily change, profit and loss, return on investment, recent transaction activity, and a 12-month ATR measure for price variability. Search, sorting, ticker-level transaction history, and linked price charts make the table both an overview and a working ledger, while the header provides the transaction controls.

Performance, Risk, and Attribution

The portfolio timeline can be switched between value, profit and loss, and percentage return. An adjustable time window focuses the analysis on a particular period, while buy and sell markers connect changes in the portfolio to the transactions behind them. A separate transaction-flow panel aggregates purchases and sales across the visible window.

Returns can be compared with the Russell 1000 or the S&P 500 ETF (SPY). The same visible period is used to calculate excess return, beta, annualized alpha, tracking error, and information ratio, making the benchmark comparison consistent with what is shown on the chart.
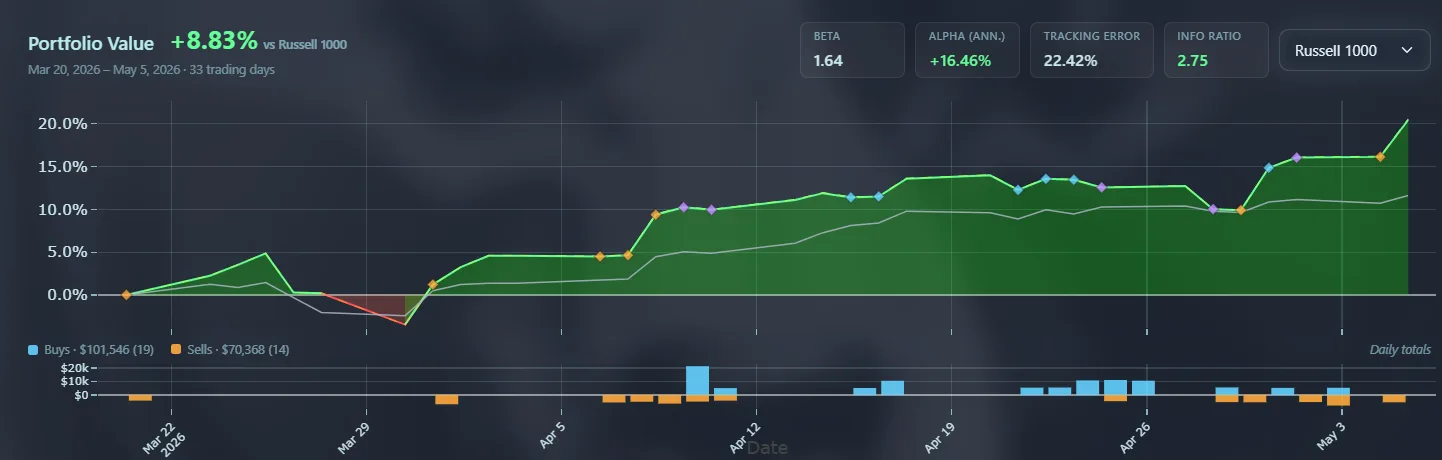
Portfolio return compared with the Russell 1000, with benchmark statistics, transaction markers, and daily buy and sell flows. The performance timeline connects benchmark-relative results with the timing and size of portfolio transactions.

The accompanying Performance Analysis moves beyond a single return figure. Its Returns view presents cash-flow-neutral, time-weighted performance through weekly, monthly, and yearly calendars with rolling risk measures. Volatility places the latest daily move within its historical distribution and reports VaR and CVaR, Drawdown follows losses from prior peaks, and Factors shows how portfolio exposure to market and style factors has changed over time.

Allocation and Return Drivers

Sector analytics show how capital is distributed across the portfolio and summarize its diversification. The linked Returns panel then separates three related questions: which holdings are moving today, how each sector contributes to the daily result, and which systematic factors have contributed over a selectable trailing period. The daily treemap sizes every holding by market value and colors it by its latest return, making both concentration and immediate performance visible at once.
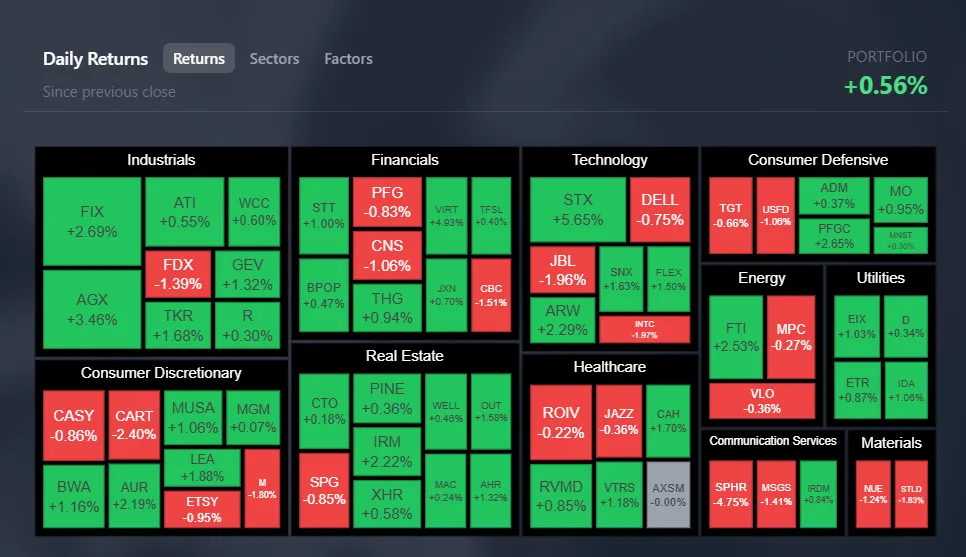
Daily portfolio returns shown as a market-value-weighted treemap grouped by sector. The daily-return view reveals whether the portfolio’s move is broad, concentrated in a few positions, or being driven by a particular sector.

A configurable buy-and-sell panel can also scan current holdings and new candidates against chosen metric thresholds. The results explain which rule was triggered and link directly to the relevant chart and transaction workflow, turning the screen into an auditable starting point rather than an unexplained recommendation.

From Optimization to a Rebalancing Plan

The Portfolio Optimizer compares the current allocation with a quantitative target. It supports objectives based on return and volatility, downside and drawdown risk, risk parity, hierarchical risk parity, inverse-risk weighting, equal weighting, and selected factor tilts. Depending on the method, targets such as volatility, return, clustering approach, or factor emphasis can be adjusted before running the analysis.

Results are organized into four complementary views. Flow traces capital from current holdings through sector or factor groups into the target portfolio. Risk Contribution compares how much risk each holding contributes before and after optimization. Factors contrasts current and target style exposures and decomposes predicted risk into market, sector, style, and idiosyncratic components. Allocations translates target weights into position-level dollar and share changes, including explicit buy, sell, and hold instructions.
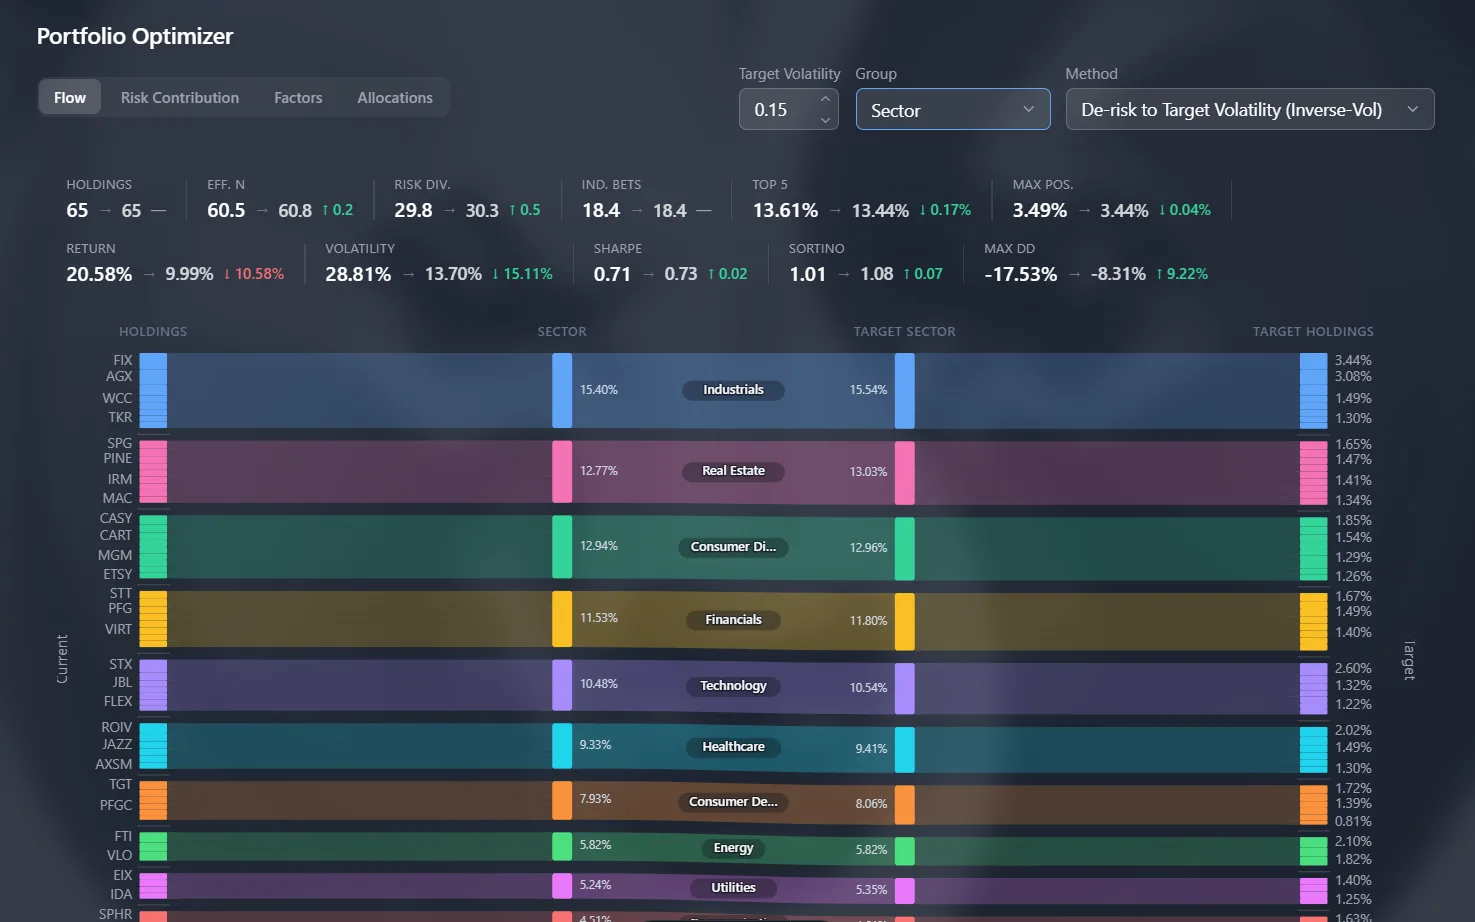
Portfolio Optimizer showing capital flows from current holdings and sectors to a target-volatility allocation. Current and target portfolios are compared through concentration, diversification, realized walk-forward return, volatility, risk-adjusted performance, and drawdown statistics before any allocation change is considered.

Inspect the Portfolio in Company Context

The Portfolio view returns to the individual securities behind the aggregate statistics. A sector-grouped treemap shows the structure of the holdings, while the adjacent radar can describe either the selected company or the portfolio’s value-weighted characteristic and prediction profile. Selecting a holding also keeps the related news, analyst recommendations, and price chart in sync, allowing an allocation-level observation to be investigated at company level.
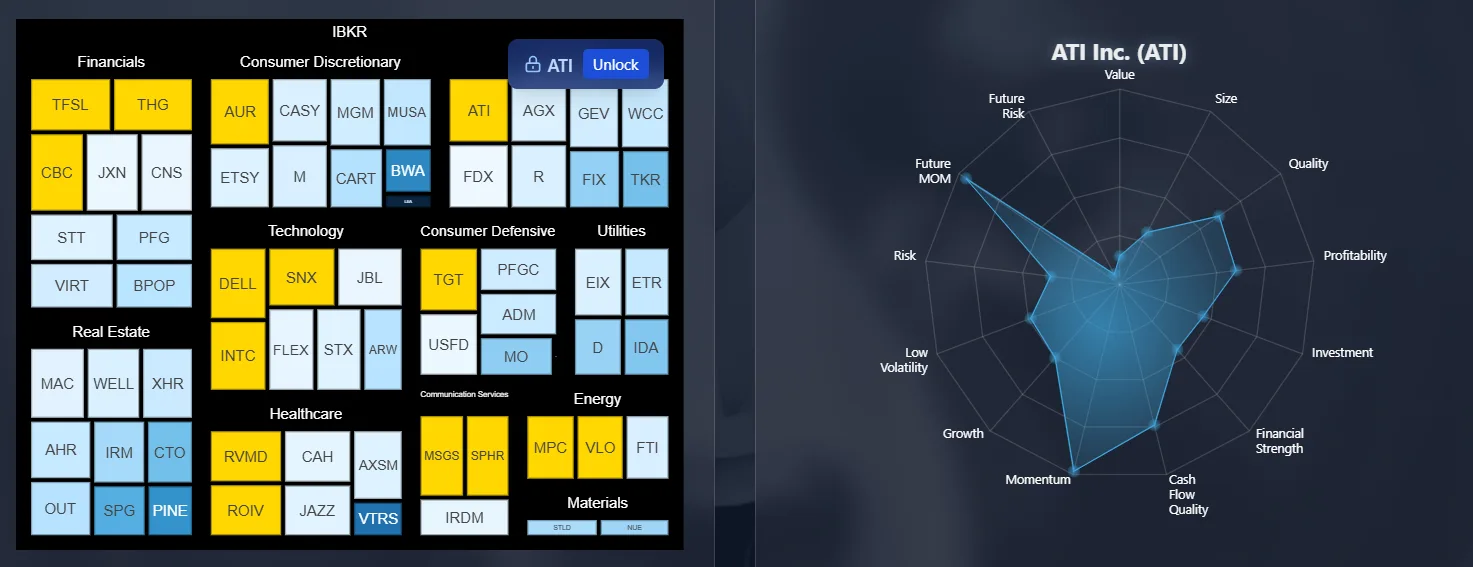
Portfolio holdings treemap beside the characteristic profile for a selected company. The linked treemap and profile radar connect portfolio composition with the characteristics of the securities inside it.

Why It Matters

A portfolio can produce an attractive headline return while hiding concentrated exposures, unstable drivers, or an inefficient distribution of risk. Portfolio Manager keeps the record of what was actually traded connected to performance, attribution, and optimization, so a proposed allocation can be understood from the portfolio level down to the specific transactions required to reach it.